How to configure network debugging using windbg
Local Laptop의 Memory가 부족해서 Hypervisor를 설치하기는 어려워, 원격지에 있는 Windows VM을 이용하여 Debugging 환경 구성이 필요했습니다.
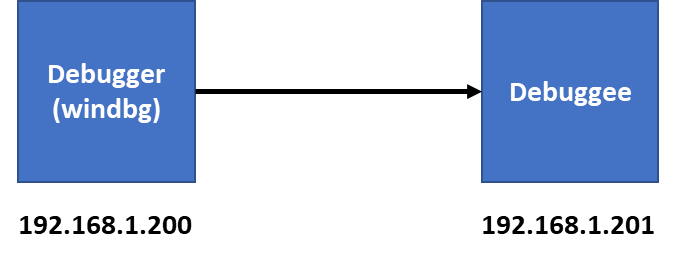
간단하게, 아래와 같은 환경에서 Windows Debugging이 필요할 때 네트워크 구성을 통해서 가능합니다.
1. Debugger에는 Windbg가 설치되어 있다고 가정합니다. Windbg는 Windows SDK를 설치할 때, 설치 항목 중 하나로 포함되어 있습니다.
2. Debuggee에는 몇 가지 설정이 필요합니다.
2-1. 우선, Debugger의 C:\Program Files (x86)\Windows Kits\10\Debuggers\x64 폴더 하위에서 kdnet.exe와 VerifiedNICList.xml 파일을 Debuggee의 임의의 폴더에 복사합니다.
2-2. 명령 프롬프트를 실행하고, kdnet.exe 파일을 복사한 폴더로 이동한 후 kdnet.exe를 실행하여, Debuggee에서 사용하는 NIC가 Network debugging을 지원하는 NIC인지 확인해야 합니다.
본 예제에서는 busparams 값이 27.0.0인 NIC를 이용합니다.
| C:\KDNet>kdnet Network debugging is supported on the following NICs: busparams=27.0.0, Intel(R) 82574L Gigabit Network Connection #2, KDNET is running on this NIC. busparams=11.0.0, Intel(R) 82574L Gigabit Network Connection, Plugged in. Network debugging is not supported on any of this machine's USB controllers. |
2-3. Debuggee에서 debug 설정을 진행합니다. 아래 예제에서 50039는 포트로 50000~50039 사이의 포트 사용을 권장하고 있습니다.
| C:\KDNet>bcdedit /debug on C:\KDNet>kdnet 192.168.1.200 50039 C:\KDNet>bcdedit /set "{dbgsettings}" busparams 27.0.0 |
2-4. bcdedit 명령어로 올바르게 debug 설정이 되었는지 확인합니다. 아래 결과에서 key 속성 값은 Debugger에서 사용해야 하므로, 별도로 복사해놓고 있으면 됩니다.
| C:\KDNet>bcdedit /dbgsettings busparams 27.0.0 key 3kg0ekmhzhghu.1owtmu2jyfesp.30zo1p2tpzyj7.5m9tsaay2w07 debugtype NET hostip 192.168.1.200 port 50039 dhcp Yes The operation completed successfully. |
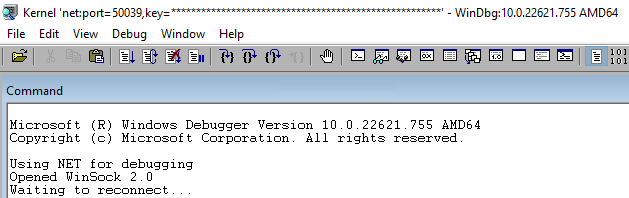
3. Debugger에서는 Windbg를 실행하고, Debuggee에서 설저한 포트 번호와 Key 값을 이용하여 Debuggee에 연결을 시도 합니다.
Windbg > File > Kernel Debug > NET

아직 Debuggee를 재부팅하지 않았기 때문에, Waiting to reconnect 상태에서 대기합니다.
4. 이제 Debuggee를 재시작하면, 다음과 같이 Debugger의 Windbg가 Debuggee에 연결이 시작됩니다.

5. 테스트를 위해서 Windbg에서 Break 신호를 Debuggee에 보내고, Symbol 을 설정합니다.
정상적으로 Symbol 설정이 되었다고 가정하고 !process extension 명령어로 프로세스 정보가 조회되는지 확인합니다.
| Microsoft (R) Windows Debugger Version 10.0.22621.755 AMD64 Copyright (c) Microsoft Corporation. All rights reserved. Using NET for debugging Opened WinSock 2.0 Waiting to reconnect... Connected to target 192.168.1.124 on port 50039 on local IP 192.168.1.200. You can get the target MAC address by running .kdtargetmac command. Connected to Windows 10 17763 x64 target at (Tue Jan 24 22:55:25.749 2023 (UTC - 8:00)), ptr64 TRUE Kernel Debugger connection established. Symbol search path is: srv* Executable search path is: Windows 10 Kernel Version 17763 MP (1 procs) Free x64 Edition build lab: 17763.1.amd64fre.rs5_release.180914-1434 Machine Name: Kernel base = 0xfffff800`36e14000 PsLoadedModuleList = 0xfffff800`3722d710 System Uptime: 0 days 0:00:00.421 IOINIT: Built-in driver \Driver\sacdrv failed to initialize with status - 0xC0000037 KDTARGET: Refreshing KD connection Break instruction exception - code 80000003 (first chance) ******************************************************************************* * * * You are seeing this message because you pressed either * * CTRL+C (if you run console kernel debugger) or, * * CTRL+BREAK (if you run GUI kernel debugger), * * on your debugger machine's keyboard. * * * * THIS IS NOT A BUG OR A SYSTEM CRASH * * * * If you did not intend to break into the debugger, press the "g" key, then * * press the "Enter" key now. This message might immediately reappear. If it * * does, press "g" and "Enter" again. * * * ******************************************************************************* nt!DbgBreakPointWithStatus: fffff800`36fd2600 cc int 3 0: kd> .sympath srv*c:\sym\websym*https://msdl.microsoft.com/download/symbols Symbol search path is: srv*c:\sym\websym*https://msdl.microsoft.com/download/symbols Expanded Symbol search path is: srv*c:\sym\websym*https://msdl.microsoft.com/download/symbols ************* Path validation summary ************** Response Time (ms) Location Deferred srv*c:\sym\websym*https://msdl.microsoft.com/download/symbols 0: kd> .reload -a Connected to Windows 10 17763 x64 target at (Tue Jan 24 22:57:32.408 2023 (UTC - 8:00)), ptr64 TRUE Loading Kernel Symbols ............................................................... ................................................................ .......................... Loading User Symbols Loading unloaded module list ......Unable to enumerate user-mode unloaded modules, Win32 error 0n30 0: kd> !process 0 0 **** NT ACTIVE PROCESS DUMP **** PROCESS ffffcf089ce67300 SessionId: none Cid: 0004 Peb: 00000000 ParentCid: 0000 DirBase: 001ad000 ObjectTable: ffffbd09fa403dc0 HandleCount: 1634. Image: System PROCESS ffffcf089cede080 SessionId: none Cid: 0058 Peb: 00000000 ParentCid: 0004 DirBase: 0e65d000 ObjectTable: ffffbd09fa40db80 HandleCount: 0. Image: Registry PROCESS ffffcf089d736040 SessionId: none Cid: 0114 Peb: 6503df3000 ParentCid: 0004 DirBase: 03e12000 ObjectTable: ffffbd09faaeab00 HandleCount: 53. Image: smss.exe PROCESS ffffcf089d722080 SessionId: 0 Cid: 0180 Peb: 294fc12000 ParentCid: 0174 DirBase: 10199d000 ObjectTable: ffffbd09faaecc00 HandleCount: 404. Image: csrss.exe <snippet> |
정상적으로 정보가 조회된다면, 이제부터는 Debugging을 시작할 준비가 다 완료된 것입니다.